

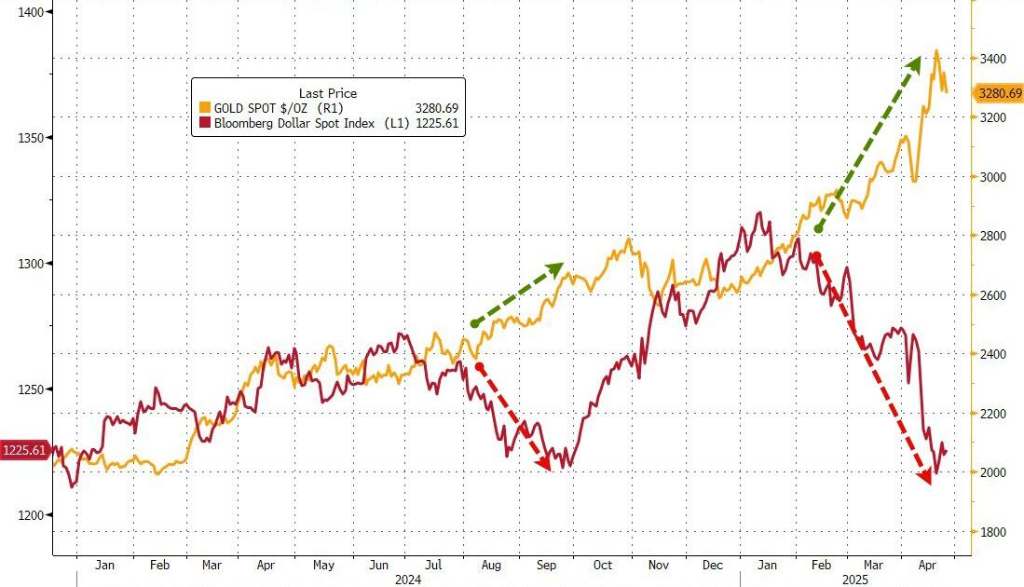
Recently, the price of gold broke through $3,500 to hit a record high, attracting the attention of global investors.
However, the latest research by Nomura Securities shows that three key indicators at the same time send warning signals, indicating that the gold market may be about to usher in a wave of "technical correction", and the adjustment may be "considerable".
Red light for economic slowdown: Capex indicators are on alert
Recently, Nomura's team of economists found a worrying phenomenon: the Fed's Composite Expected Capital Expenditure Index fell below -4. The index aggregates survey data from each regional central bank and is calculated on a weighted average based on the economic contribution of each region.
Put simply, when the index falls sharply into negative territory, it usually means that companies' confidence in future investments has decreased, and the actual core capital goods orders may be reduced next. This situation often reflects that external factors such as tariff policies have begun to weigh on the real economy.
In the report, Nomura noted that the indicator has a very strong early warning ability — five of the past six alerts have been successful in predicting a recession. Specifically:
The Russell Index (which represents economically sensitive or cyclical sectors) usually performs very negatively over the next 3 months.
The yield on the 10-year Treasury note rises over the next two weeks to one month before turning down. What's even more interesting is that when the index falls below -4, gold tends to underperform over the next two months.
According to Nomura, the index is expected to fall further to the -6 level in April, further reinforcing the current warning signals. In other words, if the laws of history are fulfilled again, the economy may face greater downward pressure in the coming months.
The indicator flashes a red light often means that the market will enter a phase of high volatility, and investors are advised to be prepared for defense.
Abnormal flow of funds: a sharp cooling after the market frenzy
The second warning sign comes from the flow of funds.
Nomura has observed a historical outlier of "gold frenzy" in the current market: the data shows that in just two weeks, GLD (the world's largest gold-backed ETF) experienced inflows exceeding 95% of the all-time level, followed by single-day outflows that also exceeded the all-time 95% level.
Put simply, this means that a large amount of money rushes into the gold market for a short period of time and then quickly withdraws. According to Nomura's analysis, this phenomenon reflects the beginning of the unwinding of positions by "late entrants/weak holders", which could trigger a larger sell-off.
According to Nomura's data, this "big in, big out" pattern has occurred a total of nine times in history, and the first eight times almost accurately predicted a correction for gold, and the worst performance is usually concentrated in the next two months.
Here's a specific figure: Earlier this week, investors withdrew $1.27 billion from SPDR gold-backed ETFs, the biggest one-day outflow since 2011. The massive withdrawal coincided with gold hitting an all-time high above $3,500.
Notably, a similar outflow occurred in 2011, at the peak of gold's last supercycle. Subsequently, gold entered a long period of consolidation, only to break through in 2020.
The current flow of funds in the gold market shows obvious anomalies, and this "big in, big out" pattern often signals an imminent price correction. For investors, this is an important warning sign to stay vigilant and avoid blindly following the herd after the market frenzy.
The deviation of gold prices from the long-term moving average is too large
The third alert is based on technical analysis.
At the end of last week, gold was already trading more than 25% above the 200-day moving average. Nomura described the situation as "rather ridiculous" (pretty absurd). In other words, gold has moved far from its long-term trend line, which historically usually means that the market needs to correct.
According to Nomura's historical data analysis, whenever gold prices deviate so much from their 200-day moving averages, they tend to experience significant pullbacks over the next two months. This is not the first time this phenomenon has occurred, and historical data shows that markets tend to self-correct in such situations and return to a more reasonable level.
Imagine if a river suddenly deviates from its course and flows to a very high place, it will eventually return to its original course. By the same token, when the price of gold deviates significantly from its long-term trend line, market mechanisms usually push the price back to a more normal level.
Overall, the large divergence between the current gold price and the 200-day moving average is an important technical warning sign. For investors, this means that gold prices could be at risk of a correction in the coming months. Therefore, it is very necessary to be cautious at the current highs.